- Products: LTM2214 Software Utilities
- Four software utilities, all running on Win32, are supplied by Advanced Measurement Solutions:
- LTM2214-RCU Remote Control Utility
- LTM2214-RCU is a freeware software tool running under Windows (XP, Vista, 7, NT) which connects to LTM2214 torque meter by means of its two serial communication ports using a built in proprietary protocol.
- Using this software tool LTM2214 torque meter can be remotely controlled by a standard PC.
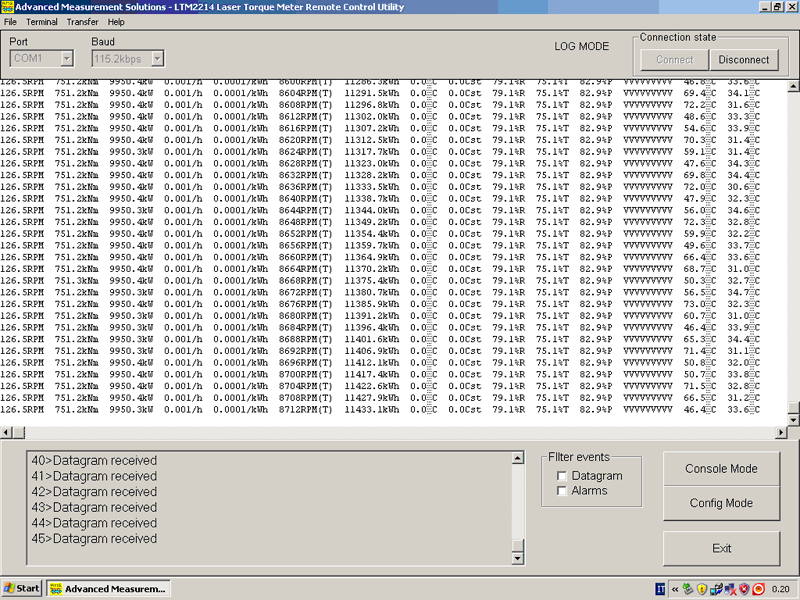
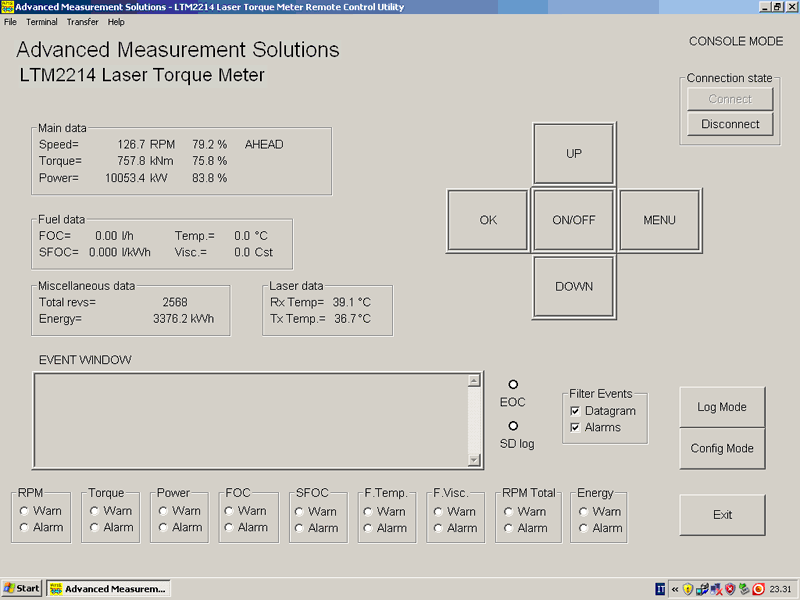
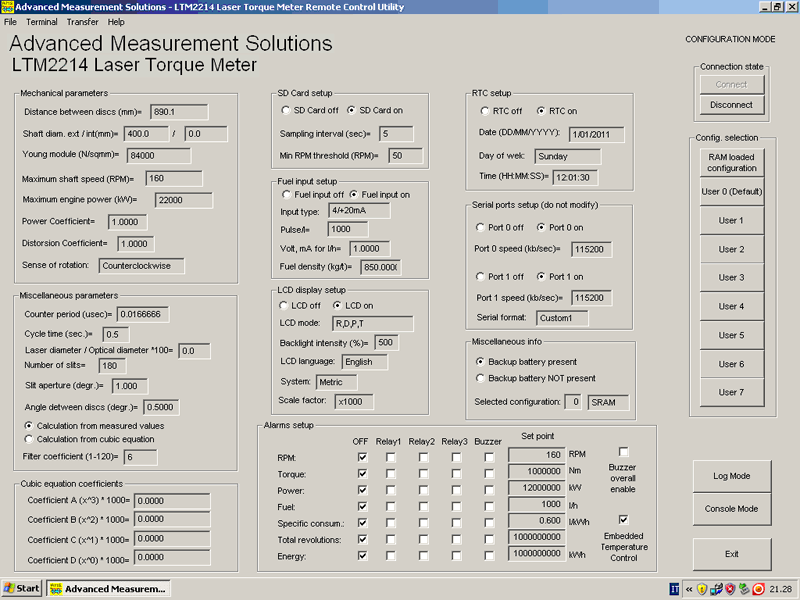
- Three operating modes are available: log mode, console mode and configuration mode.
- Console mode provides a user friendly interface as the displayed page layout is very similar to the LTM2214-DFM torque meter front panel.
- The main features of this operating mode are:
- Control buttons (UP, DOWN, OK, MENU, ON/OFF) corresponding to the LTM2214 keypad ones
- Real time display of all measured data
- Event window (displays received event messages)
- Events filtering (to prevent displaying, in the event window, datagrams and alarm messages)
- Warnings and Alarms display in the dedicated alarms windows
- End of Cycle (EOC) signalling (communication active)
- SD card activity signalling
- Connection management
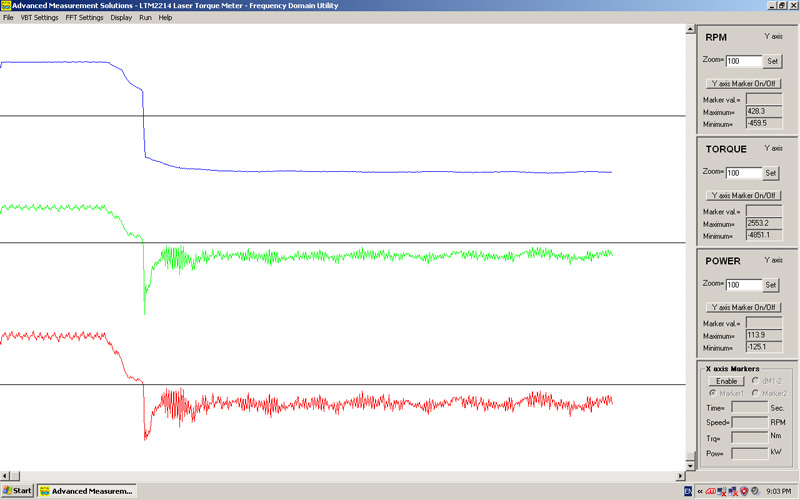
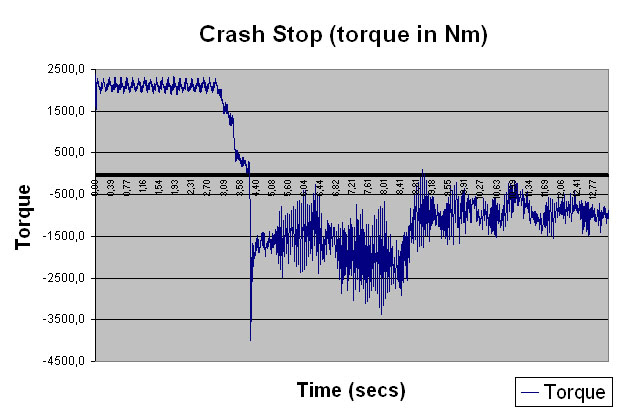
- LTM2214-TDM Time Domain analysis utility
- LTM2214-TDM is a freeware software tool running under Windows (XP, Vista, 7, NT) for postprocessing and analysis of vibrotorsional sampled data in the time domain. All its features are included in LTM2214-FDM software tool.
- It calculates the amplitude of torsional vibrations, power fluctuations and RPM variations, and plots all these variables.
- The vibrotorsional samplings carried out by the LTM2214 can last for more than 20 minutes and permit to analyze the dynamic behaviour of the system with a resolution of few milliseconds.
- Mechanical system parameters display (in a dedicated dialog window)
- Filtering parameters selection from dialog window
- Graph display selection (1 or 3 graphs) from dialog window
- Two X axis markers (with delta marker) and display of all the data of the selected sample
- One Y axis marker for each plotted graph (with display of the measured value in the side panel)
- Maximum and minimum calculation for each plotted graph (in the side panel)
- Adjustable scaling factor for each plotted graph (in the side panel)
- Plot autoscale
- X axis scroll
- X axis zoom between marker 1 and marker 2
- Automatic recalculation
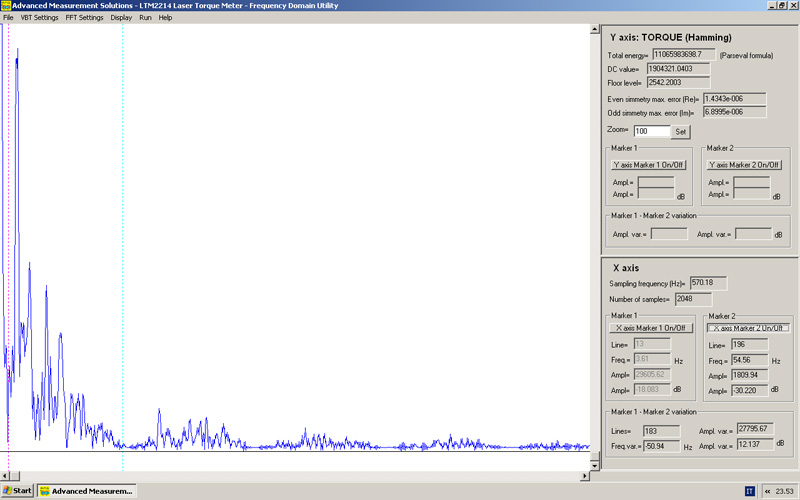
- LTM2214-FDM Frequency Domain analysis utility
- LTM2214-FDM is a cost effective software tool running under Windows (XP, Vista, 7, NT) for postprocessing and analysis of vibrotorsional sampled data in the time and frequency domains (see user manual for additional info).
- It calculates and plots the Fast Fourier Transform (FFT) and thus the spectrum of torsional vibrations.
- The utility can effectively be used to carry out a predictive failure analysis of the mechanical system thus significantly reducing system downtime.
- The vibrotorsional samplings carried out by the LTM2214 can last for more than 20 minutes and permit to analyze the dynamic behaviour of the system with a resolution of few milliseconds.
- The demo version has all the features of LTM2214-TDM utility. Its only limitation is that it plots a reference FFT not related to the input file. So, in case only time domain features are required, the user has can use either LTM2214-TDM or LTM2214-FDM utility.
- LTM2214-FDM utility permits to load a vibrotorsional sampling (.vbt), an intermediate time domain output file (.tdm) or a frequency domain file (.fdm). The results of the processing is stored in a time domain output text file (.tdm) and in a frequency domain one (.fdm).
- Various options are available such as:
- All the options present in time domain mode (see LTM2214-TDM utility)
- FFT filtering window selection (flat top, hamming, blackman)
- Graph display selection (raw data, filtered RPM, unfiltered RPM, torque, power)
- Two X axis markers (with delta marker) with all spectral line data
- Two Y axis marker (with delta marker) with amplitude and dB indication
- Total energy, DC value and floor level calculation
- FFT odd and even symmetry errors calculation
- FFT equivalent sampling frequency calculation
- Maximum samples available calculation
- Spectral lines display
- Display of armonics (analytic calculation)
- Display of peaks (heuristic calculation)
- DC and floor cancellation
- Output text files (.tdm and .fdm) can be opened with a spreadsheet in order to allow the user to manipulate processed data.
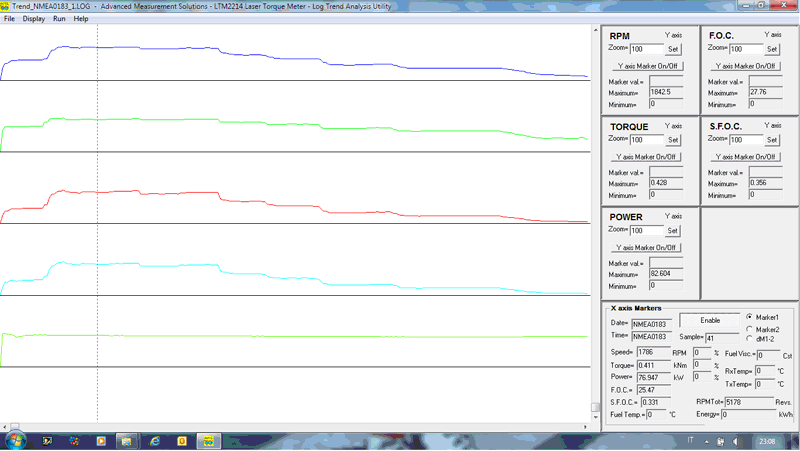
- LTM2214-LTA Log Trend Analysis utility
- LTM2214-LTA is a cost effective software tool running under Windows (XP, Vista, 7, NT) for the trend analysis of log files generated by the LTM2214 torque meter or by LTM2214_RCU utility (see user manual for additional info). Log files (.log) are stored by the LTM2214 on the SD card or, for time limited samplings, can be generated by the remote control utility LTM2214-RCU using “Receive File” function.
- The LTM2214-LTA utility can be used in demo mode to display only the first 256 samples of the log file, while the following samples are ignored. All the other features of the utility are fully available.
- In registered mode more than 8 milion samples for each trend can be loaded and displayed (which corresponds to more than 97 working days at a sampling rate of one sample per second, or to more than 388 days at the more usual a sampling rate of one sample each four seconds).
- A custom version of the LTM2214-LTA utility with an increased trending capability is available upon request, but it is not normally supplied as it requires a PC with a larger system memory. This may cause malfunctioning in PCs with limited performance.
- The utility can effectively be used to investigate propulsion system working parameters variations during normal operation and to better understand the origin of failures, abnormal behaviours, etc...
- The utility plots the graphs of the trends of RPM, torque, power, instant and specific fuel consumption (SFC).
- Various options are available such as:
- Trend display selection (1, 3 or 5 trends) from dialog window
- Two X axis markers (with delta marker) and display of all the data of the selected sample
- One Y axis marker for each plotted graph (with display of the measured value in the side panel)
- Maximum and minimum calculation for each plotted graph (in the side panel)
- Adjustable scaling factor for each plotted graph (in the side panel)
- Plot autoscale
- X axis scroll
- X axis zoom between marker 1 and marker 2
- Automatic recalculation
- Log files (.log) are text files and thus can be opened with a spreadsheet in order to allow the user to manipulate stored data.
|
Laser Torque Meters
|
||||||||||
|
|
|
|||||||||
|
||||||||||